Using python and k-means to find the dominant colors in images
I'm working on a little photography website for my Dad and thought it would be neat to extract color information from photographs. I tried a couple of different approaches before finding one that works pretty well. This approach uses k-means clustering to cluster the pixels in groups based on their color. The center of those resulting clusters are then the "dominant" colors. k-means is a great fit for this problem because it is (usually) fast. It has the caveat of requiring you to specify up-front how many clusters you want -- I found that it works well when I specified around 3.
A warning
I'm no expert on data-mining -- almost all my experience comes from reading Toby Segaran's excellent book Programming Collective Intelligence. In one of the first chapters Toby covers clustering algorithms, including a nice treatment of k-means, so if you want to really learn from an expert I'd suggest picking up a copy. You won't be disappointed.
How it works
The way I understand it to work is you start with a bunch of data points. For simplicity let's say they're numbers on a number-line. You want to group the numbers into "k" clusters, so pick "k" points randomly from the data to use as your "clusters".
Now loop over every point in the data and calculate its distance to each of the "k" clusters. Find the nearest cluster and associate that point with the cluster. When you've looped over all the points they should all be assigned to one of the "k" clusters. Now, for each cluster recalculate its center by averaging the distances of all the associated points and start over.
When the centers stop moving very much you can stop looping. You will end up with something like this -- the points are colored based on what "cluster" they are in and the dark-black circles indicate the centers of each cluster.
Applying it to photographs
The neat thing about this algorithm is, since it relies only on a simple distance calculation, you can extend it out to multi-dimensional data. Color is often represented using 3 channels, Red, Green, and Blue. So what I did was treat all the pixels in the image like points on a 3-dimensional space. That's all there was to it!
I made a few optimizations along the way:
- resize the image down to 200x200 or so using PIL
- instead of storing "duplicate" points, store a count with each -- saves on calculations
Looking at some results
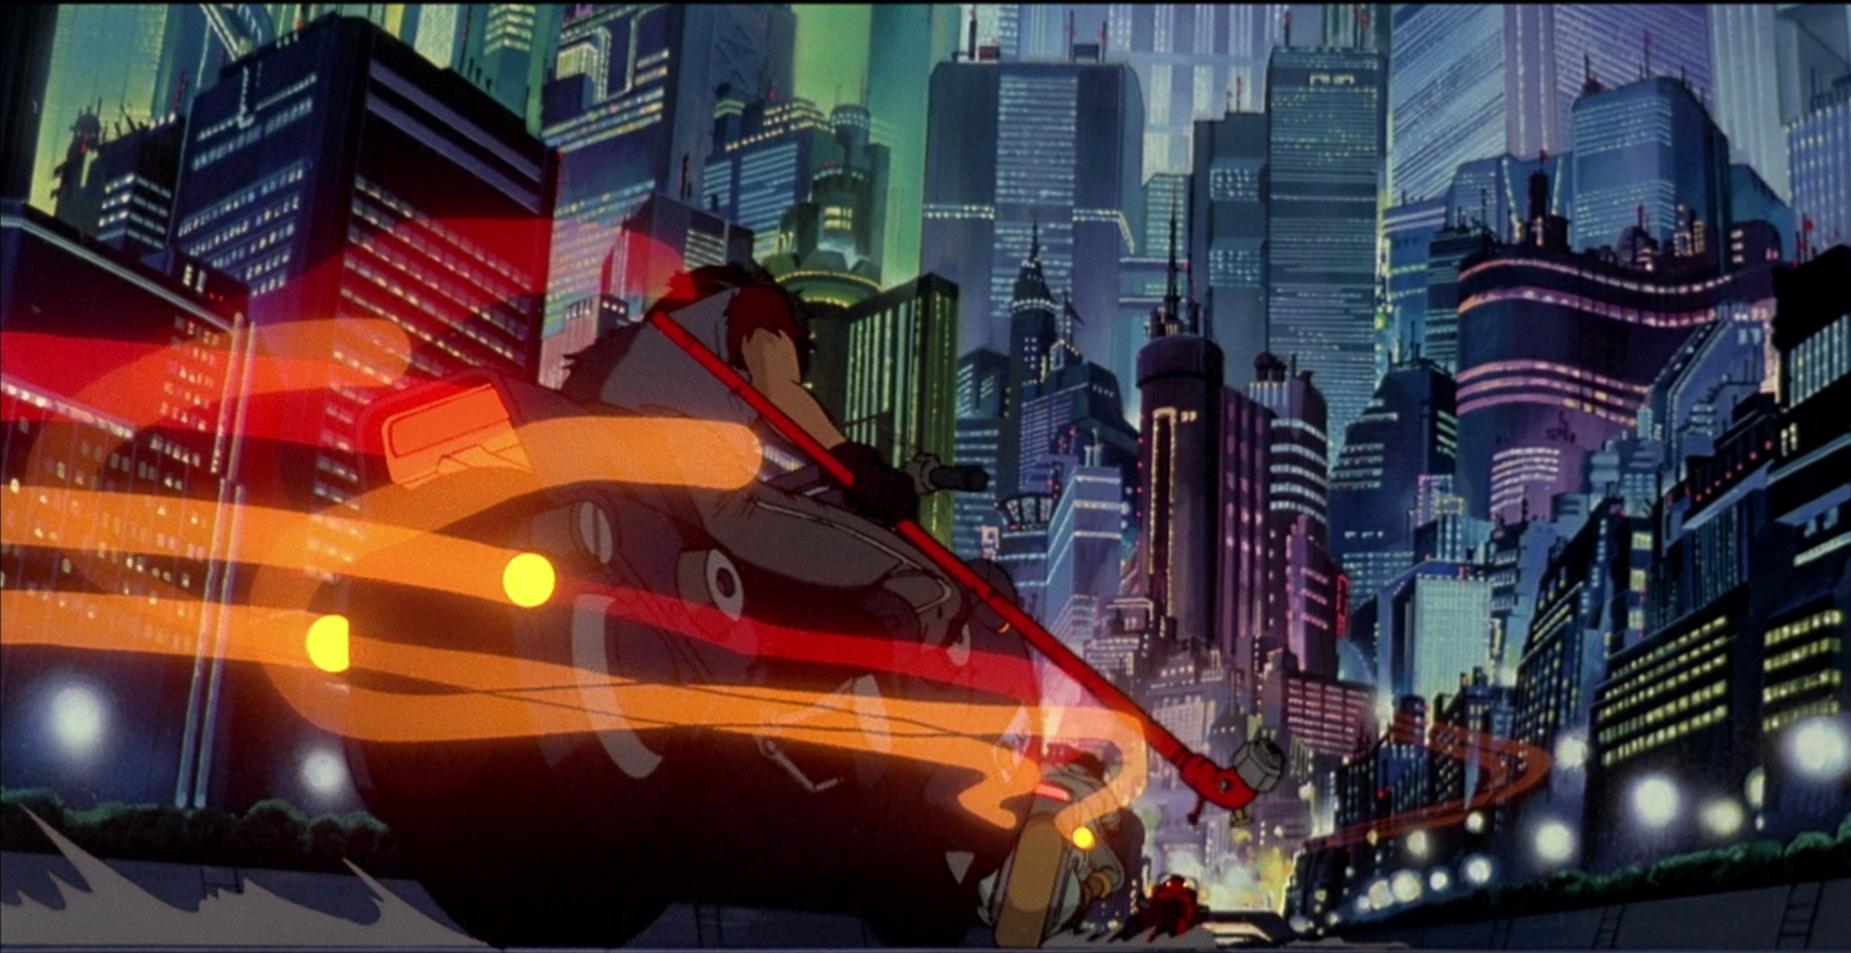
The results:

The results:
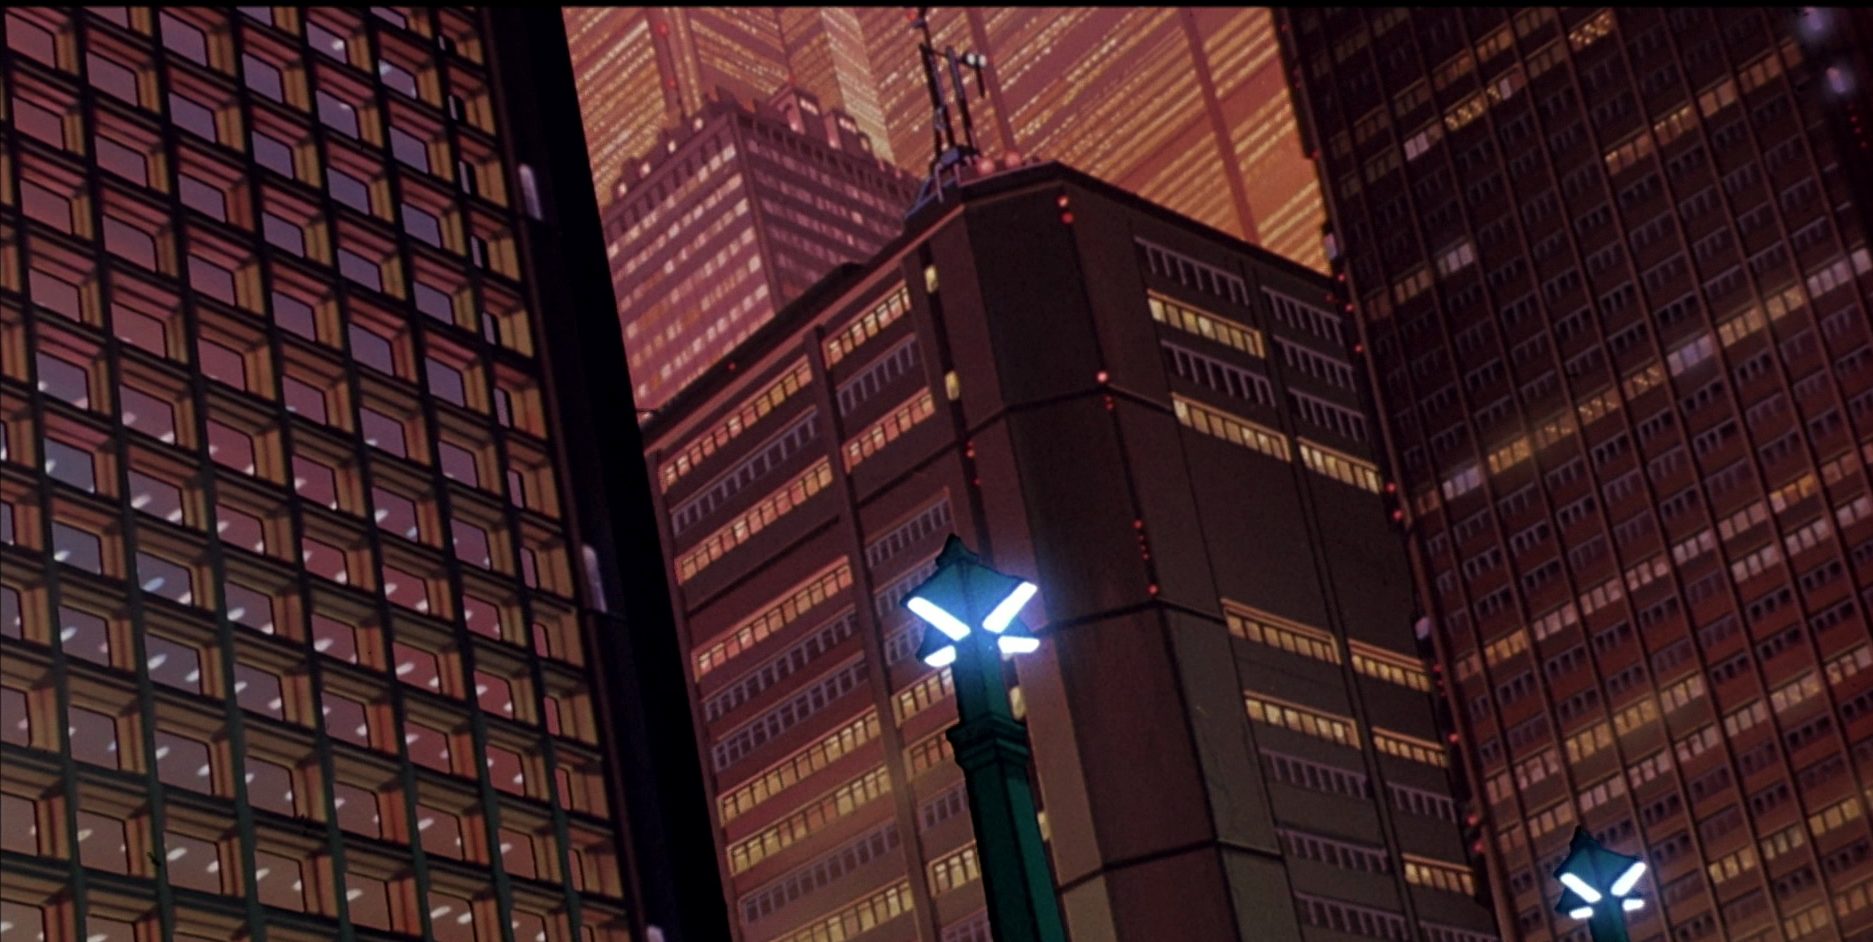
The results:
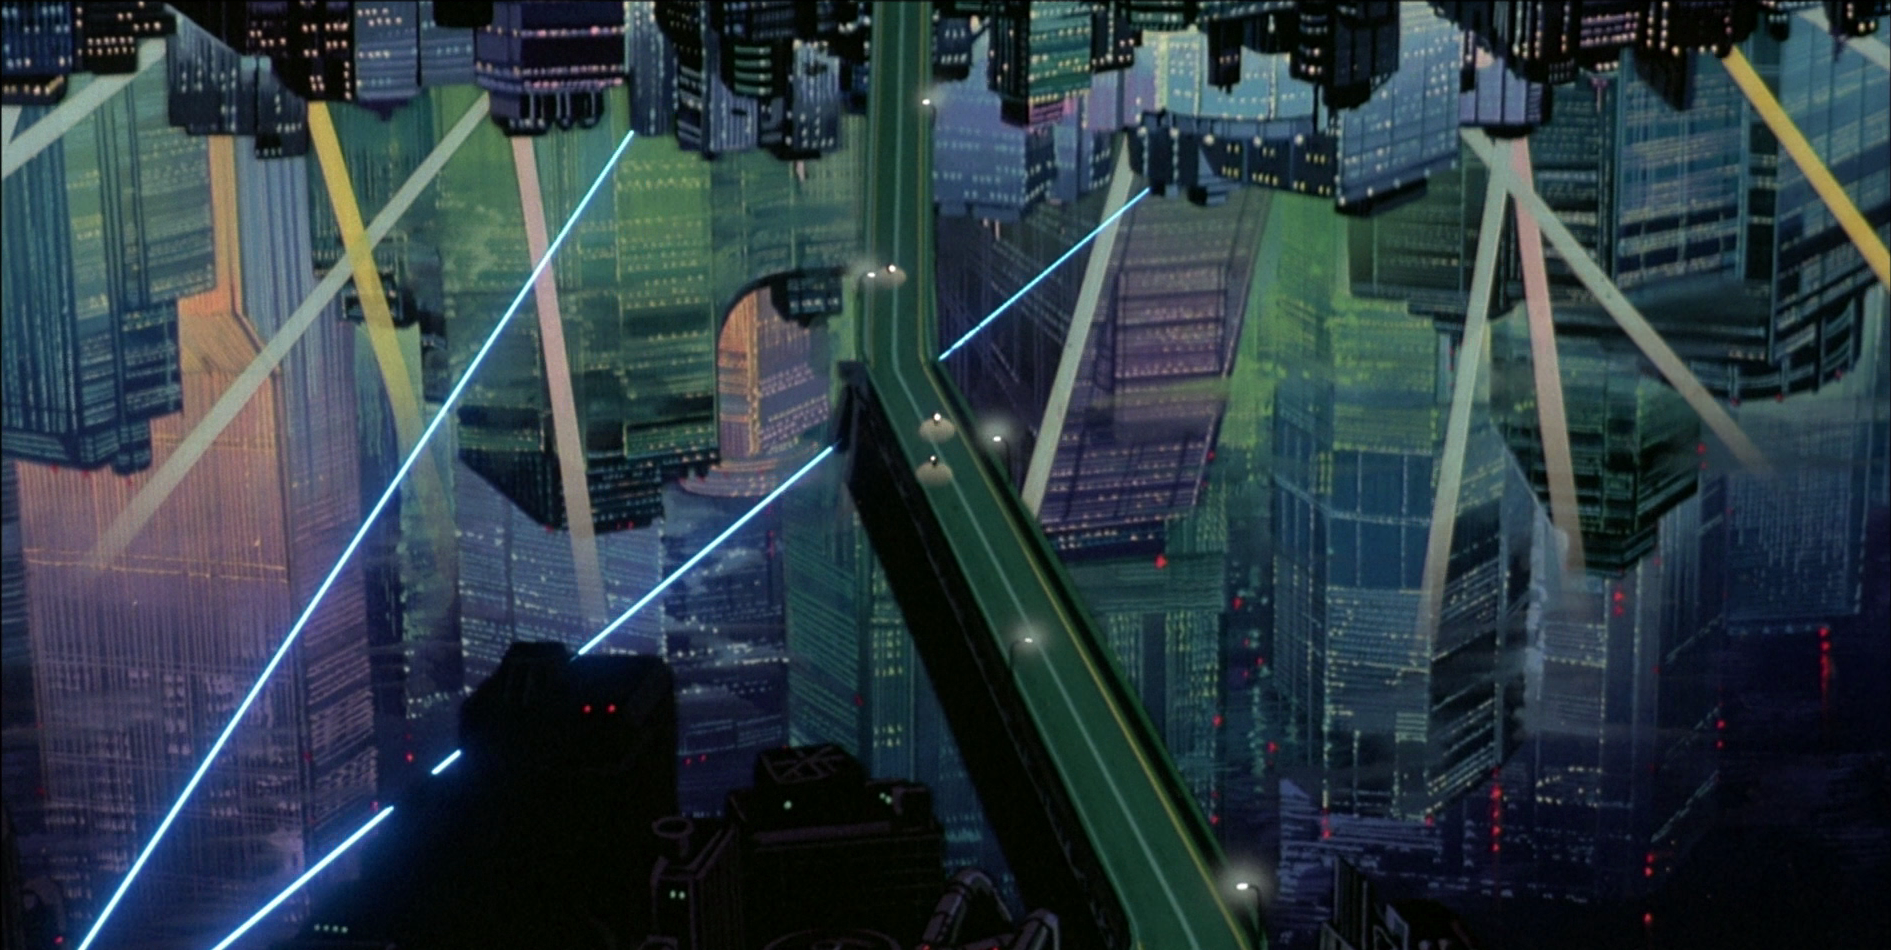
The results:
The source code
Below is the source code. It requires PIL to resize the image down to 200x200 and to extract the colors/counts. The "colorz" function is the one that returns the actual color codes for a filename.
from collections import namedtuple
from math import sqrt
import random
try:
    import Image
except ImportError:
    from PIL import Image

Point = namedtuple('Point', ('coords', 'n', 'ct'))
Cluster = namedtuple('Cluster', ('points', 'center', 'n'))

def get_points(img):
    points = []
    w, h = img.size
    for count, color in img.getcolors(w * h):
        points.append(Point(color, 3, count))
    return points

rtoh = lambda rgb: '#%s' % ''.join(('%02x' % p for p in rgb))

def colorz(filename, n=3):
    img = Image.open(filename)
    img.thumbnail((200, 200))
    w, h = img.size

    points = get_points(img)
    clusters = kmeans(points, n, 1)
    rgbs = [map(int, c.center.coords) for c in clusters]
    return map(rtoh, rgbs)

def euclidean(p1, p2):
    return sqrt(sum([
        (p1.coords[i] - p2.coords[i]) ** 2 for i in range(p1.n)
    ]))

def calculate_center(points, n):
    vals = [0.0 for i in range(n)]
    plen = 0
    for p in points:
        plen += p.ct
        for i in range(n):
            vals[i] += (p.coords[i] * p.ct)
    return Point([(v / plen) for v in vals], n, 1)

def kmeans(points, k, min_diff):
    clusters = [Cluster([p], p, p.n) for p in random.sample(points, k)]

    while 1:
        plists = [[] for i in range(k)]

        for p in points:
            smallest_distance = float('Inf')
            for i in range(k):
                distance = euclidean(p, clusters[i].center)
                if distance < smallest_distance:
                    smallest_distance = distance
                    idx = i
            plists[idx].append(p)

        diff = 0
        for i in range(k):
            old = clusters[i]
            center = calculate_center(plists[i], old.n)
            new = Cluster(plists[i], center, old.n)
            clusters[i] = new
            diff = max(diff, euclidean(old.center, new.center))

        if diff < min_diff:
            break

    return clusters
Thanks for reading
Thanks for reading, I hope you found this post interesting. I am sure this is not the only approach so if you have other ideas please feel free to leave a comment or contact me directly.
Links
- A commenter on reddit posted this gist, showing how he used the script to generate console color themes and more using the methods outlined in this post: https://gist.github.com/3946121
- Another commenter on reddit posted a link to scipy, which has built-in support for kmeans: http://docs.scipy.org/doc/scipy/reference/cluster.vq.html
Comments (17)
Tim Wilder | oct 28 2012, at 02:05pm
Great entry. It was succinct, informative, and pretty interesting. Thank you for posting!
pit | oct 26 2012, at 04:19am
Is there online version of this or similar script?
Mark Ransom | oct 25 2012, at 10:27pm
@Samantha, one easy way to speed it up would be to remove the sqrt() function from the euclidean distance calculation. When comparing distances it doesn't matter if you compare the actual distance or the square of the distance.
Cushen | oct 25 2012, at 06:04am
This is a similar application and might be of interest:
http://mkweb.bcgsc.ca/color_summarizer/
Matt W | oct 25 2012, at 04:19am
We were using similar techniques in the 1990s on analytical microscope data to try to unravel the information held in multivariate signals.
ai_ja_nai | oct 25 2012, at 03:36am
Nice application. But, due to the resize to 200x200 to reduce search space, don't you end to smooth the dataset too much, resulting in a lot of approximations in pixel counts?
Hugh Brown | oct 24 2012, at 08:57pm
def points(img): w, h = img.size return [Point(color, 3, count) for count, color in img.getcolors(w * h)]
Marjan | oct 24 2012, at 08:20pm
This was the coolest thing i have ever seen in making a real use of clustering algorithms. Well done
Phillip Cloud | oct 24 2012, at 08:13pm
You should try scikits-learn. They have a nicely encapsulated kmeans algorithm. It's very fast.
Samantha K | oct 24 2012, at 07:52pm
Can this algorithm be speed up? It runs over 10 seconds on my computer for each image. I've several hundred thousand of images to process. I could wait 1 second per image but 10 is a bit too much.
Mathew Sanders | oct 24 2012, at 04:47pm
@Ryan I wonder if using HSL instead of RGB as the colour model and somehow shifting the center of the cluster to have more weight on the saturation axis (we tend to perceive saturated colours to 'pop' out more).
@Charles this is a great project! I've often asked developers if we could do something like this to automatically tag images but I've always been told that it's too expensive :( super impressed with your javascript implementation!
Adam | oct 24 2012, at 04:44pm
Consider while True: instead of while 1:. More readable, and doesn't incur a type conversion every iteration.
David | oct 24 2012, at 03:54pm
Would be really nice to see in a gallery. With each image the page adapts the colors around it =)
Ryan O'Hern | oct 24 2012, at 03:54pm
An interesting extension to this would be to weight more highly data points for colors that are "eye grabbing". For example, in the motorbike picture, you have captured the most common three shades in the image, but the blue lights dominate the viewer's perception (at least for me). If I were choosing dominant colors to do a styling template for something like...Warhammer pieces (this is the only thing that comes to mind, strangely) not choosing that bright blue color would be strange, nay? At least as an accent. Perhaps you could capture a fourth data point exclusive to this feature to give exactly that: accent color.
You may know that k-means can mess up and give non-optimal clustering due to local optimums. You might want to add an additional step to run k-means N times and then choose the trial with the min cost value averaged over all data points (where cost is distance to the matched centroid) as your result.
Cool post and simple implementation. I like.
Jim Bumgardner | oct 24 2012, at 03:24pm
I've been using this method for a few years. A neat extension to it enables you to determine a "foreground" and "background color. The cluster with the most pixels near the center of the image is "foreground". The cluster with the most pixels near the edges is "background".
Stephen | oct 24 2012, at 12:21am
Neat. I can see using something like this to power those ambient color lights behind some TVs.
Commenting has been closed.
Shashank | oct 29 2012, at 04:33am
Nice post. I guess this is the same method used in Windows7 to shade the taskbar icons on mouse hover.