Experimenting with an analytics web-service using python and cassandra
The other day I was poking around my google analytics account and thought it would be a fun project to see if I could collect "analytics"-type data myself. I recalled that the Apache Cassandra project was supposed to use a data model similar to Google's BigTable so I decided to use it for this project. The BigTable data model turned out to be a good fit for this project once I got over some of the intricacies of dealing with time-series data in Cassandra. In this post I'll talk about how I went about modelling, collecting, and finally analyzing basic page-view data I collected from this very blog.
Modelling time-series with Cassandra
Cassandra (like Bigtable) is defined as "a sparse, distributed, persistent
multi-dimensional sorted map." As a python developer, the way I've gone about picturing
this is a large dictionary containing strings as keys and OrderedDict as
values (which is incidentally how pycassa models data):
# column family "Users"
users = {
    'coleifer@example.com': OrderedDict(
        ('name', 'Charles Leifer'),
        ('occupation', 'Programmer'),
    ),
    'someone@example.com': OrderedDict(
        ('name', 'Someone Else'),
    ),
}
Just to point out a couple things:
- the top-level (column family) dictionary is not sorted by default. Cassandra users will tell you this is for the best, because it is helpful in preventing certain nodes from becoming "hotspots" of activity.
- the values of the top-level dictionary contain arbitrary key/value pairs and are sorted by key using one of several "comparator" types (bytes, utf8, timestamp, etc)
So, how to go about modelling page-views?
Attempt #1: screw it let's sort the keys
My initial attempt got shot down first by a number of blog posts, then by the users
of #cassandra on freenode. I intended to use timestamps as the keys, then store
the page-view data as the columns. To do this, I needed to edit the cassandra conf
to use the ByteOrderedPartitioner and instruct cassandra that my keys were going
to be timestamps so order them appropriately. There are valid usecases
for the ordered partitioner, but since Cassandra gives you column-level ordering
for free it seemed like a bad idea to continue down this path. Additionally,
a single row can contain (theoretically) something like 2B column name/value pairs,
making the "columns" (the inner dictionary) an attractive place to store page-views.
Attempt #2: screw it let's use supercolumns
My second attempt was not a whole lot better. I simply "pushed" everything down a level and used an "account id" as the row key. This gave me something like:
PageViews = {
    '<account id>': OrderedDict(
        (timestamp1, <PAGE VIEW DATA>),
        (timestamp2, <PAGE VIEW DATA>),
    )
}
Cassandra has this interesting feature called "super-columns" (wtf) which allow you to nest columns within columns. I decided to make PageView a "super-column" so my data model looked like:
PageViews = {
    '<account id>': OrderedDict(
        # the columns themselves contain dictionaries as their values
        (timestamp1, {'url': '...', 'title': '...', 'ip': '...'}),
        (timestamp2, {'url': '...', 'title': '...', 'ip': '...'}),
    )
}
Then I read that supercolumns were actually a pretty bad idea and would be replaced with composite columns. The other problem is that a single account's row can grow without bounds in this schema. If a site got on average 10 page-views/second, that would be 3600 * 24 * 10 == 864,000 new columns a day...that's a pretty big row to be slicing and dicing and moving in/out of memory.
Attempt #3: let's shard on date and serialize everything
My next attempt is what I ended up sticking with. Because I have multiple sites I wanted to keep the data for each in uniquely named rows. I ended up using a key composed of an account ID and a date shard (one row per account per day, but could be modified to fit your needs). Then, to fix the problem of supercolumns, I simply serialized all the page-view data using msgpack. It looks like this:
PageViews = {
    '20120801.<account_id>': OrderedDict(
        (timestamp1, <serialized pageview data>),
        (timestamp2, <serialized pageview data>),
    ),
    '20120731.<account_id>': OrderedDict(
        ...
    ),

}
The data cannot be queried by value (e.g. query serialized data) in this way, but it is very easy to retrieve multiple days' worth of data (the rows), and in each row to retrieve slices of various intervals for a given account. Later I'll show how I threw together a tiny map/reduce helper to process the actual serialized page-view data.
An equally viable alternative would be to store the account id in a composite column alongside the timestamp.
Collecting the data (this was fun)
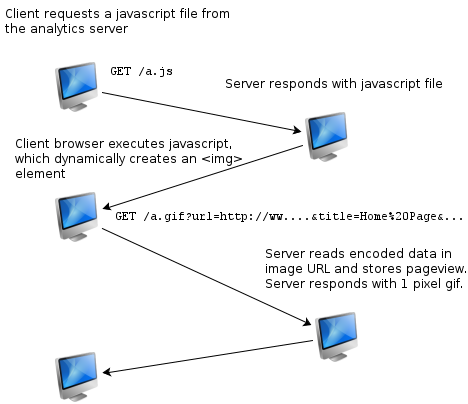
I remember hearing of how people had used 1-pixel gifs to retrieve analytics data, and this works surprisingly well. I'm pretty sure you can't generally push results from the client using ajax because of cross-domain restrictions, so a workaround is to have some javascript dynamically create an image. The image's URL carries a payload of data about the current page, such as the URL, title, referrer, etc. The browser goes out to load the image at the given URL, which is conveniently located on your server, and your server decodes the page-view information, stores it, and returns a single-pixel gif. On a basic level, this is what google analytics does.
To serve the javascript and gif, as well as coordinate the storage, I chose to use flask. The app would be responsible for 2 views, the request for the javascript file and the request for the gif.
from flask import Flask, request, Response

app = Flask(__name__)


@app.route('/a.gif')
def analyze():
    # pull data out of args & headers
    data = <parse data from request.args and request.headers>

    # store data in cassandra
    <store data>(**data)

    response = Response(<single pixel gif>, mimetype='image/gif')

    # note the no-cache headers on the response
    response.headers['Cache-Control'] = 'private, no-cache'
    return response

@app.route('/a.js')
def analytics_code():
    return Response(<javascript>, mimetype='text/javascript')
The gif and javascript were stored in local variables. The javascript source itself looks like this:
(function() {
    var doc = document,
        img = new Image,
        esc = encodeURIComponent;
    img.src = 'http://analytics.xxx/a.gif' + \
        '?url=' + esc(doc.location.href) + \
        '&ref=' + esc(doc.referrer) + \
        '&title=' + esc(doc.title);
})();
The img that gets dynamically created has a src attribute that looks something
like this (would be url encoded):
src=http://analytics.xxx/a.gif?url=http://myblog/some-post/&title=Some post&ref=..
The actual request from the client's browser for the image contains other interesting info like their IP address and any request headers the browser sends like language and user-agent.
Here is a sampling of the code I used to extract the data and store it:
@app.route('/a.gif')
def analyze():
    # pull parameters off the request and the headers
    args, headers = request.args, request.headers
    data = dict(
        title=args.get('title', ''),
        ip=headers['x-real-ip'], # i'm using nginx in front
        referrer=args.get('ref', ''),
        user_agent=headers['user-agent'],
        language=headers.get('accept-language', '').split(',')[0],
    )

    acct_id = str(args.get('id', ''))
    url = args.get('url') or ''

    # spawn a green thread to store the data
    gevent.spawn(store_data, acct_id, url, **data)

    response = Response(BEACON, mimetype='image/gif')
    response.headers['Cache-Control'] = 'private, no-cache'
    return response

def store_data(id, url, **data):
    # add the url to the data
    data['url'] = url

    cur_time = datetime.datetime.utcnow()
    time_uuid = convert_time_to_uuid(cur_time)

    row_key = '%s.%s' % (cur_time.strftime('%Y%m%d'), id)

    PageViews.insert(row_key, {
        time_uuid: msgpack.packb(data)
    })
Analyzing the data to get simple counts
Suppose I wanted to get counts of page-views for a single day, grouped by URL. Its very easy to iterate over a slice of columns and store counts:
counts = {}
day = datetime.datetime(2012, 8, 1)
key = '%s.%s' % (day.strftime('%Y%m%d'), '<account id>')

query = PageViews.xget(key) # query is a generator

for (ts, data) in query:
    data = msgpack.unpackb(data)
    counts.setdefault(data['url'], 0)
    counts[data['url']] += 1
If I just wanted an hour's worth of data, I could specify a "column_start" and "column_finish" indicating the times I wanted to query:
start = datetime.datetime(2012, 8, 1, 7, 0) # 7am
finish = start + datetime.timedelta(seconds=2*60*60) # 9am

query = PageViews.xget(key, column_start=start, column_finish=finish)
This type of analysis lends itself well to a map/reduce workflow. I wrote up 2 little python helpers to make this easier. The first generates lists of keys for a given date range, the second wraps the map/reduce process to avoid having to write duplicate "deserialization" code.
def prep_query(id, start_date, end_date):
    keys = []
    start_uuid = convert_time_to_uuid(start_date)
    end_uuid = convert_time_to_uuid(end_date)

    while start_date <= end_date:
        keys.append('%s.%s' % (start_date.strftime('%Y%m%d'), id))
        start_date += datetime.timedelta(days=1)

    return keys, start_uuid, end_uuid

def map_reduce(id, start_date, end_date, map_fn, reduce_fn, initializer=None):
    """
    Very primitive map/reduce -- map functions will receive a generator that
    iterates over pageview columns.  The iterable is of the form:

        (account_id, datetime of pageview, pageview data)
    """
    keys, column_start, column_finish = prep_query(id, start_date, end_date)

    # wrap the multiget operation for passing in as the map_fn
    def wrapped(k):
        try:
            gen = PageViews.xget(k, column_start=column_start, column_finish=column_finish)
        except NotFoundException:
            pass
        else:
            for ts, data in gen:
                converted = convert_uuid_to_time(ts)
                unpacked = msgpack.unpackb(data)
                yield (id, datetime.datetime.fromtimestamp(converted), unpacked)

    mapped_results = []
    for result in map(map_fn, map(wrapped, keys)):
        mapped_results.append(result)

    return reduce(reduce_fn, mapped_results, initializer)
Again, here is the "page-view counter" code rewritten to use our helper functions. While this example is lengthier and less efficient than the example above, it shows the potential for parallelizing this kind of work:
def map_fn(columns):
    results = []
    for id, ts, data in columns:
        results.append((data['url'], 1))
    return results

def reduce_fn(accum, item):
    for title, ct in item:
        accum.setdefault(title, 0)
        accum[title] += ct
    return accum

map_reduce(<acct id>, <start_date>, <end_date>, map_fn, reduce_fn, {})
Your map functions can do all sorts of interesting things, like:
- looking at referrers to parse inbound search queries
- looking at user agent strings to analyze mobile/desktop traffic
- geocoding IP addresses and grouping by geographical area
- etc...etc...etc
Ideas for improvements and interesting links
One thing I noticed while looking at the google analytics "dance" is that it does some things with cookies to track new versus returning visitors -- this would be a pretty neat feature. It might also be cool to denormalize page-view data and store page-views by IP (especially if you have a large number of sites) and try to isolate individual users that way (I'm sure Google is correlating all of the information it collects to generate a "unique" picture of an individual's browsing history, based on simple things like user-agent and IP address).
It would be great for the javascript library to expose a lightweight API for folks on the client-side to send custom events. Google does this with their analytics platform and it is regularly used to measure ad campaigns.
Finally, this code is very naive! It's my first experiment with Cassandra and very likely there are interesting features I've overlooked in my simplistic data model. If anyone out there has suggestions on improving it or has had success with alternate models I'd love to hear about it.
Here are a couple links and references I found helpful while working on this:
- Learning cassandra slide deck
- Basic time series with Cassandra
- Advanced time series with Cassandra
- Cassandra docs
- Data model overview
- pycassa
- Bigtable paper
If you're interested in more projects like this, check out the saturday-morning hack posts.
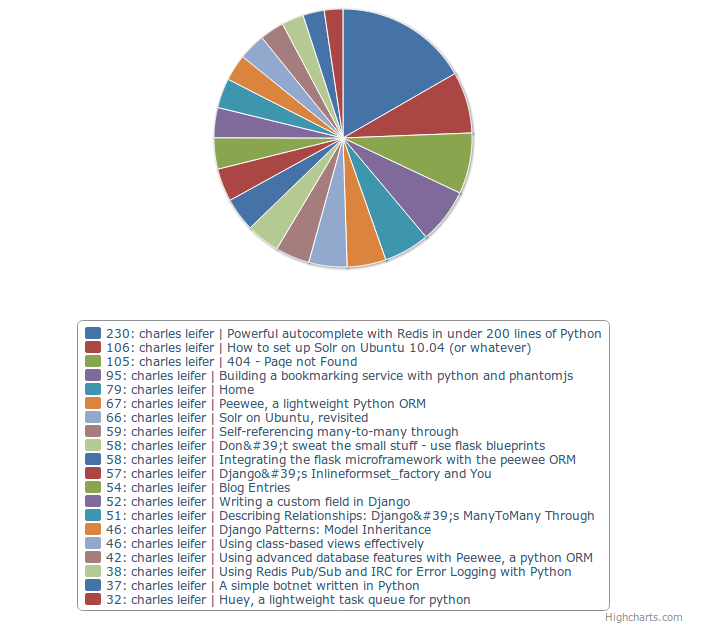
Hope you enjoyed reading! Here's a lil' screenshot from a web frontend I built atop this:
Comments (2)
Terry Nathan | aug 16 2012, at 05:28pm
Interesting post! I'd like to start experimenting with a lot of the things you've mentioned here e.g. map-reduce, home-grown analytics, and I'll be sure to refer back to this when I get to it. By the way, you can use "from collections import defaultdict" and then d = defaultdict(int) to do the counting of urls you were doing earlier.
Commenting has been closed.
Simon Rumble | aug 21 2012, at 02:05am
You should check out SnowPlow which is a loosely-coupled web analytics tool set designed to use Hadoop for the data processing. Though each component could be swapped out on demand.
http://snowplowanalytics.com/